
Survey Data SVM
To use the SVM classifier on this set of data, several different steps had to be taken to process and clean the data. First, the census data needed to be read into a dataframe. The survey data contained information on how people answered by race, gender, and age, but for this model, only the total was considered. Then, since SVMs required only numeric data, information on lockdowns or characteristics associated with the survey. After processing the data and cleaning it, the following data was written to a file and shown below. The Sometimes and Lack of Variety columns were removed from the table to fit the screen, but they still exist in the data.
Results
Below is a set of SVMs that were tuned based on different kernels. Those kernels include linear, polynomial, radial based, and sigmoid. After tuning those SVMs, there were still several different options, so in the end, there is a proposal for the best SVM given the data.
Linear Kernel
A linear kernel is the simplest kernel when it comes to creating a hyperplane. In two dimensions, the linear kernel produced a decision boundary that is always a straight line. In three dimensions, it is a flat hyperplane. In higher dimensions, the same concept applies. Below is an example of the linear kernel.
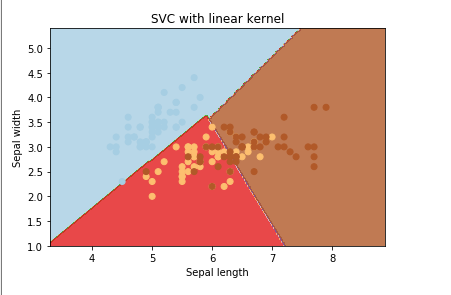
The two visualizations shown below are the classification plot after the data was trained using an SVM and the confusion matrix after the SVM was run on a test data set. Since a single SVM can only handle two variables, the two most important variables that were relatively independent of each other were plotted. The plot of FoodHospitalityEmploymentRate vs NotEnough shows that most of the points should end up in the NorthCentral (dark red) or the South Region. Indeed, the confusion matrix confirms this. This is not a good model to use given the cost function, but as an example, it is shown here. For the best version of the SVM model, please look towards the bottom for the last model. For information, the cost function is set to 200, but any cost function really didn't work with the model and data.


Polynomial Kernel
A polynomial kernel is similar to a linear kernel, but it allows for combinations of features to determine similarity. This allows for the learning of nonlinear models. In 2 dimensions, the decision boundary can be a polynomial function, similar to the one seen in the image below. Extending that idea to n-dimension hyperplanes requires a lot of tuning to make sense.

Here, similar to the linear model above, the polynomial does no better. It might do worse. Per the classification plot, most of the points will be classified into the North Central region, and after viewing the resulting confusion matrix, this is confirmed. Again, this is not the ideal model, but an example of the polynomial kernel on this data. Also, this SVM only contains two variables, which is unlikely for a real world scenario. The cost function here is 100, but setting it to pretty much anything doesn't help.


Radial Basis Kernel
A radial basis kernel is one of the most widely used forms of kernelization since it is very similar to the normal distribution. This kernel function compares points for similarity (or how close they are, like KNN). This function is tuned using the cost function and the gamma parameter. An example of an output of a radial kernel is below.

Here a radial basis kernel is tried with a cost function again set to 5000 and got better results than linear/polynomial. However, after tuning it, adding more variables, and tinkering around with some hyperparameters, this model turns out to be the best. See the final model at the end of the page for more information.


Sigmoid Kernel
A sigmoid kernel is used mainly for neural networks. The function is similar to a "two layer percetron model of a neural network"[https://dataaspirant.com/svm-kernels/]. This is not a neural network for text data, but it could be worth trying at least to see the results. Below is a visualization of the results of a sigmoid kernel for reference.

Finally, trying a sigmoid kernel with a cost function of 2000 generates poor results. This also can be tuned slightly better, but did not do better than the radial basis kernel in the best version below.


Best Version
After running through all of these different kernels and attempting to tune each one of them, it made sense to present the best version of the SVM developed in this research section separately. Below is the confusion matrix of the best SVM after tuning different hyperparameters such as the cost function and the kernel type. It uses a radial basis kernel with a cost function of 1000.

Seen above is a far better SVM model for the data, however, even after tuning it, it still isn't great at predicting the region. In conclusion, when it comes to trying to predict the region, the model is unable to isolate the effect of these variables on the region. Since states are more localized, it was easier to localize the model to states, however, when it comes to regions, it was less clear.
Conclusion
In conclusion, even using the best SVM metrics, the model was unable to predict the correct classes using the test data. This could imply two things. One, the SVM model was the incorrect model for this particular section of research. Two, even if the model was correct, the data was not able to isolate the effect and correctly classify the region associated with the data. After a lot of tuning, it was possible to predict the West and South region decently well according to the confusion matrix, but not well enough to justify the use of this model.