
Search Data SVM
To run SVM classification properly using the search data, a couple of steps must be taken to clean up and preprocess the data. First, the data needs to be combined. Right now, there is data coming from articles mined using the Google Search API automatically, but also, there is data coming from manually searching google for research articles on the effects of different disasters on food security and food supply. These articles were very difficult to automatically process, so by manually choosing researched articles, the quality of the data was improved greatly. Once the data was combined, it can be visualized using a variety of different methods, but the simplest is a wordcloud. Below is a set of wordcloud's, one per topic.


As seen in the wordclouds, the larger the word, the more times it shows up in the article, and hypothetically, the more important the word is with regards to the article. Now, unlike previous wordcloud's generated during this project, it was very important to remove the words that were close or the same as the actual topic. So words like covid, drought, ebola, and locust are removed since that would bias the algorithm. Plus since this is not clustering, which doesn't care about the labels, unlike decision trees, which is a supervised machine learning algorithm. Importantly, when building these models, the data needed to be normalized, so a TFIDF vectorizer was used.
Results
Using SVMs, the important features are not easily visualized, so the only reviewable results are the results of tuning different hyperparameters and accessing the quality of the model produced by each support vector machine. Below are the results for support vector machines using different kernels and cost parameters. For each kernel, an explanation is provided to gain a better insight into how the model is generating the results and whether the results make sense.
Linear Kernel
A linear kernel is the simplest kernel when it comes to creating a hyperplane. In two dimensions, the linear kernel produced a decision boundary that is always a straight line. In three dimensions, it is a flat hyperplane. In higher dimensions, the same concept applies. Below is an example of the linear kernel.
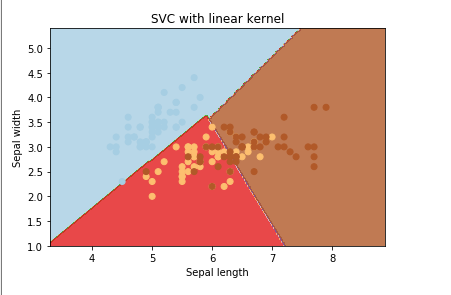
Many times, the simplest kernel turns out to be the best. In this case, the linear kernel produces a confusion matrix that has a pretty good prediction rate and did not require much tuning of the cost function. Here again it is difficult to distinguish Covid-19 from other disasters, most likely because Covid-19 transcends all articles as it affects everything in life.

Polynomial Kernel
A polynomial kernel is similar to a linear kernel, but it allows for combinations of features to determine similarity. This allows for the learning of nonlinear models. In 2 dimensions, the decision boundary can be a polynomial function, similar to the one seen in the image below. Extending that idea to n-dimension hyperplanes requires a lot of tuning to make sense.

The polynomial function required a lot of tuning, but even after a lot of tuning of the degree of the function and the cost function, the results are quite poor as compared to the linear kernel. There was no further investigation into using this model, but the results of the model are shown below.

Radial Basis Kernel
A radial basis kernel is one of the most widely used forms of kernelization since it is very similar to the normal distribution. This kernel function compares points for similarity (or how close they are, like KNN). This function is tuned using the cost function and the gamma parameter. An example of an output of a radial kernel is below.

After tuning the radial basis function using the cost function and gamma parameter, the results of the predictions using the model are still not as good as the linear model. The cost function that was used was 10 and the gamma parameter was set to auto. The results are visualized using a confusion matrix below.

Sigmoid Kernel
A sigmoid kernel is used mainly for neural networks. The function is similar to a "two layer percetron model of a neural network"[https://dataaspirant.com/svm-kernels/]. This is not a neural network for text data, but it could be worth trying at least to see the results. Below is a visualization of the results of a sigmoid kernel for reference.

Interestingly, the results using a sigmoid kernel are pretty good considering the amount of tuning of the cost function (set to 5), was negligible. However, using the linear kernel is still the way to go. The results for the confusion matrix are below.

Conclusion
By using an SVM, a pretty good model is generated that gives us some power to predict the type of disaster given some set of words and how often they show up. However, by using an SVM, it is not clear how the model is working, so besides coming up with a model and making predictions on the type of disaster, no other conclusions can be made.